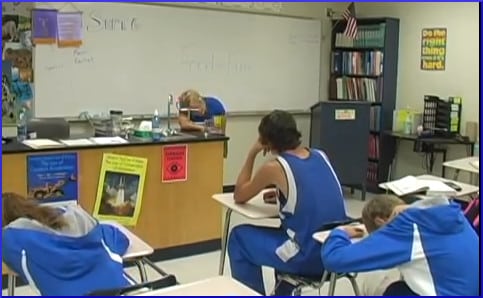
Last time, Childhood Obesity News looked at a parody music video made by a Kansas high school class. It features scenes like the one shown here, where students droop over their desks, faint with hunger, and even the teacher seems to succumb to malnutrition. This work of art, which “went viral,” succeeded in pointing out that the Department of Agriculture’s caloric-intake guidelines were perhaps too stringent, and the guidelines were subsequently relaxed.
To capture a statistical picture of what’s going on with childhood obesity, state by state, is not as easy as it might seem. Methods of measurement may differ, local information-gathering requirements might not be the same, financial limitations can mean skimpy resources, variables always intrude, and any study that depends on self-reporting has an intrinsic margin of error.
Unavoidable problems
Obesity is a particularly tricky characteristic to keep track of, because the results of ingrained habits and lifestyle choices are not always immediately apparent. Longitudinal studies scrutinize long-term results and attempt to pinpoint causes that may lie 10 or 20 years in the past. Administering such studies is complicated, difficult, and expensive.
Even in the short term, statistics need to be assembled and collated and verified and published. There is always a time lag. Even a February 2014 article in the very authoritative Journal of the American Medical Association bases its conclusions on data gathered in 2011-2012.
Often the current position of affairs is hard to assess. When administrative bodies decide how to respond to trends, a delayed reaction is the only possible kind to have. When policies have only been in effect for a year or two, how accurately can their effects, for better or worse, be measured? F as in Fat, a website sponsored by the Robert Wood Johnson Foundation, gives this report on the signs of childhood obesity progress in Kansas:
A new report released by the Centers for Disease Control and Prevention (CDC) in August, 2013 showed that 18 states, including Kansas … experienced a decline in obesity rates among 2- to 4-year-olds from low-income families between 2008 and 2011. Over that period, Kansas’s rate fell from 13.3% to 12.7%, a statistically significant decrease according to the CDC analysis.
But that only applies to children between 2 and 4, an important but very small demographic slice, and the latest numbers were collected in 2011. According to the same year’s numbers, the obesity rate among 10- to 17-year-olds is 14.2%, and among high school students (partly the same age group) the rate is 10.2%.
At the Childhood Obesity Action Network page for Kansas, the most recent numbers seem to be from 2006. In the category “State Rank for overweight or obese children” the state is in 27th place. Not the best, not the worst, it’s just about in the middle. Also, Kansas is true Middle America, smack dab in the center of the continental United States map. Next time, we focus on what this statistically average state has been doing to alleviate childhood obesity.
Your responses and feedback are welcome!
Source: “Prevalence of Childhood and Adult Obesity in the United States, 2011-2012,” jamanetwork.com, 02/26/14
Source: “The State of Obesity: Kansas,” fasinfat.org
Source: “How much do you know about the childhood obesity epidemic in Kansas?” Childhealthdata.org
Image by “We Are Hungry”
 FAQs and Media Requests: